Trend & Reversal
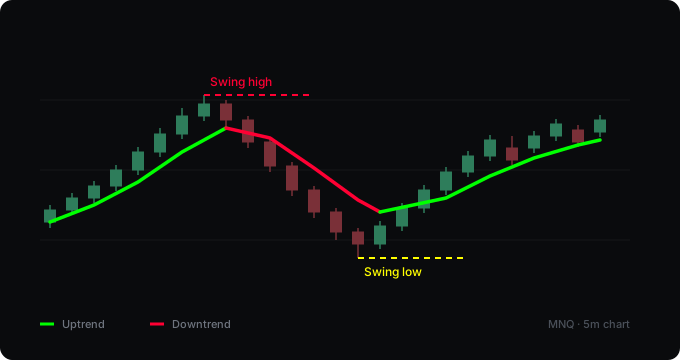
A colour-switching trend line from a higher timeframe, plus dashed markers on confirmed swing highs and lows.
What it computes
Two things, drawn together. The trend line is a Hull moving average calculated on a timeframe you choose — by default the chart's own. It turns green when price is above it and red when price is below, so the colour tells you which side of the line the market is on. The markers are pivots: a swing high is a bar whose high is above the N bars on each side of it, a swing low is the same in reverse. Each confirmed pivot gets a short dashed segment at its price.
What it assumes
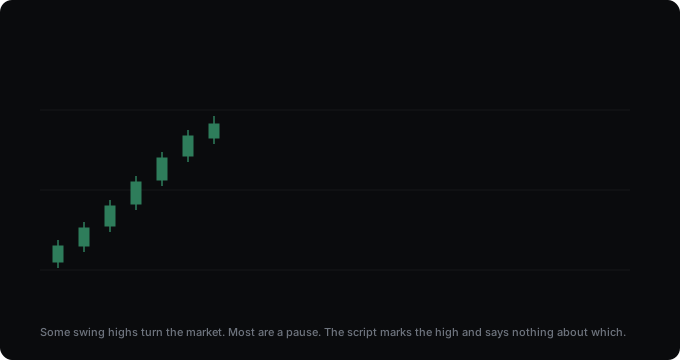
That a smoothed line from a higher timeframe filters out moves that are only noise on the chart you are watching, and that local highs and lows are the points where the market previously ran out of buyers or sellers. What it does not claim: a swing high is not a reversal. Some of them turn out to be, most are just a pause. The script marks what happened, not what will happen.
Where it falls short
- The markers appear late. A pivot is only confirmed once the lookback has passed on both sides. With the default of 20, that is 20 bars after the actual high or low. This cannot be removed — without it there would be no way to know the high was a high.
- The trend line lags, and it is supposed to. A moving average is an average of the past. In a sharp turn it will be on the wrong side for a while. It is a filter, not a signal.
- In a range the colour flips often. When price oscillates around the line, green and red alternate with no useful meaning. Raise the smoothing length, or move the trend timeframe higher.
- The dashed segment is a marker, not a level. It ends where it ends. If you want levels that carry forward, that is a different tool.
Backtest
There is none. This tool gives no entry signal: it draws a filter and marks what has already formed. What could be measured is a specific rule built on it — for example, entries only in the direction of the line. That would be a separate tool, and the measurement would be published with it.
Settings
| Setting | What it does |
|---|---|
| Smoothing length | Length of the Hull moving average. Higher means smoother and slower. |
| Trend timeframe | Which timeframe the line is calculated on. Empty means the chart's own. |
| Use only closed higher-timeframe bars | On by default. The line only updates once the higher-timeframe bar has closed, so the historical chart matches what you would have seen live. |
| Pivot lookback | How many bars must be lower on each side. This is also the delay. |
| Markers and labels | Can be toggled separately. |
| Alerts | Price crossing the line in either direction, and confirmed swing highs and lows. |
Changelog
v2.0
"Reversal (Top)" and "Reversal (Bottom)" became "Swing high" and "Swing low". A pivot is not a reversal — some become one, most are a pause, and the script cannot tell at the time. New option, on by default: use only closed higher-timeframe bars, so the historical chart matches what you would have seen live. Also: a warning if the trend timeframe is lower than the chart, alerts on trend crosses and confirmed pivots, separately toggleable markers and labels, configurable colours, and the plot renamed from "Ribbon" to "Trend line" because it draws a single line.
v1.0
First release.
How to get it
Open source and free on TradingView. Add it to your chart from the link below — no account needed here.
Open on TradingView