Micro Kernel Trend
A smoothed trend line that weights recent bars more heavily than older ones, and changes colour when its direction turns.
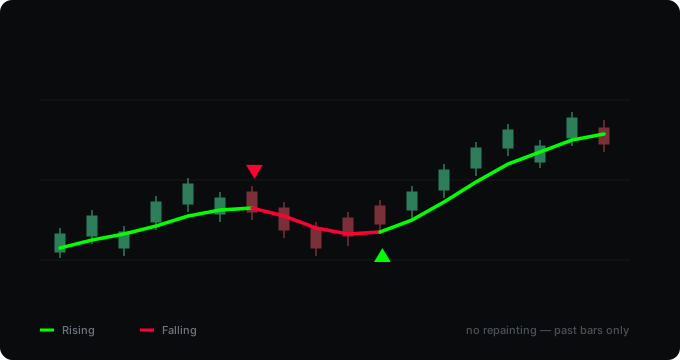
What it computes
A weighted average of past bars, where the weight falls off exponentially with distance: the most recent bar counts fully, one at ten bars back counts a fraction, and a bar far enough back contributes almost nothing. The rate of that fall-off is the bandwidth setting, and it is the only control that really matters. The line turns green when it has been rising and red when it has been falling, and an arrow marks the change.
What it assumes
That most of what price does from bar to bar is noise, and that an average which leans on recent data shows the part worth looking at. Nothing more than that. It is a filter, not a forecast — the line describes where price has been, in a form that is easier to read than the bars themselves.
Where it falls short
- It lags, and that cannot be fixed. An average of the past is late at every turn by construction. A lower bandwidth reduces the lag and increases the noise; there is no setting that gives you both.
- In a sideways range the colour changes often and means little. The minimum-move setting removes the smallest of these, but it cannot make a flat market directional.
- The arrows are not entries. They mark that the line turned, which happens long after the actual high or low. Using them as entry points means buying after the move has started and selling after it has ended.
- The calculation window should be at least about three times the bandwidth. Below that the oldest bars included still carry meaningful weight and the line is cut off rather than faded out.
Backtest
There is none. The script gives no entry, stop or target — it draws a line and marks when it turns. A rule built on it could be measured, and that would be a separate tool published with its results.
Settings
| Setting | What it does |
|---|---|
| Bandwidth | The main control. Higher is smoother and slower, lower is faster and noisier. |
| Calculation window | How many past bars are included. Keep it at roughly three times the bandwidth or more. |
| Source | Which price the average is taken from. |
| Direction confirmation bars | The line has to move the same way for this many bars before the direction changes. |
| Minimum move | How far the line has to travel before a turn counts, measured in ATR. At zero, the smallest wiggle flips the direction. |
Changelog
v2.0
Two fixes and a correction. The calculation treated bars that do not exist yet as zero, so for the first window of bars on any chart the line sat far below price before converging — the loop is now limited to the bars that actually exist. The direction came from comparing the line to its own value one bar earlier, which flips on the smallest wiggle; a turn now needs the line to have moved the same way for several bars and to have travelled a minimum distance in ATR, both adjustable. And "Buy Signal" and "Sell Signal" became "Turned up" and "Turned down", because what the script detects is the direction of an average changing, not a trade. Alerts were added — there were none. Markers can be switched off and colours are configurable.
v1.0
First release.
How to get it
Open source and free on TradingView. Add it to your chart from the link below — no account needed here.
Open on TradingView