SMC Setup & Smart Delta
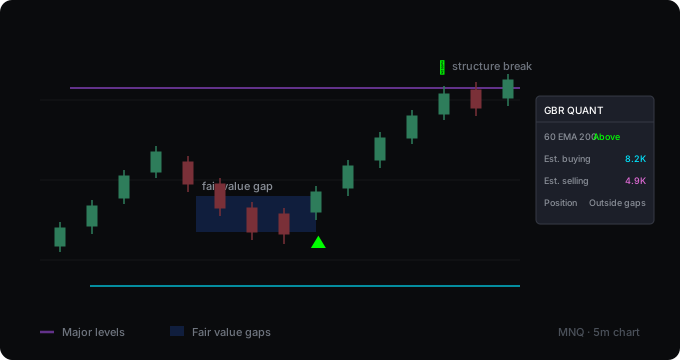
Structure breaks, major levels and fair value gaps on one chart, with a pressure estimate colouring the bars and a trend filter from a timeframe you choose.
What it computes
Four things. Swing highs and lows from a short pivot lookback give the structure, and a break is marked when price closes beyond the last confirmed one — once per level. A longer pivot lookback gives the major support and resistance lines. A fair value gap is a three-bar pattern where the first and third bar do not overlap, filtered by a minimum size in ATR; each one is drawn as a box, and a reaction is marked when price returns into it and closes with pressure in its direction. The pressure itself is estimated from where the close sits inside each bar's range, and it colours the bars and feeds the panel.
What it assumes
That a gap left by a fast move is a place price often returns to, and that a break of structure says more when it happens in the direction of the bigger trend. Both are common ideas, neither is a law. What it does not claim: the pressure estimate is not order flow — it is arithmetic on a single bar and cannot see the order book. And a reaction inside a gap is not an entry; it marks that price came back and closed a certain way.
Where it falls short
- Only the most recent gap in each direction is tracked. Older unfilled gaps stay drawn on the chart but no longer produce reactions.
- Everything appears late. Structure needs five bars on each side of a pivot by default, major levels fifteen. That delay cannot be removed without guessing which highs will hold.
- In a fast market gaps form constantly, and most of them are filled immediately without meaning anything. Raise the minimum gap size to see fewer and more significant ones.
- The trend filter steps rather than glides when confirmed bars are on. An hourly average changes once an hour, so the filter can sit in a stale place for most of that hour.
Backtest
There is none. The script marks structure, levels, gaps and reactions; it gives no entry, stop or target, so there is nothing to measure. A complete rule built on it could be measured, and that would be a separate tool published with its results.
Settings
| Setting | What it does |
|---|---|
| Minor and major pivot lookback | The first drives structure breaks, the second the major levels. Both are also the delay. |
| Minimum gap size | Measured in ATR. Raise it to see fewer and larger gaps. |
| Gap box extension | How many bars the box is drawn forward. |
| Trend filter timeframe and length | Which timeframe the EMA comes from. The panel shows which one is in use. |
| Use only closed higher-timeframe bars | On by default, so the historical chart matches what you would have seen live. |
| Pressure threshold | How far toward one end of the bar the close has to sit. |
Changelog
v2.0
The panel showed a row labelled "1H Trend Filter" while the average behind it was calculated on the chart's own timeframe — on a five-minute chart that is a 200-period five-minute average, covering about sixteen hours rather than one. The timeframe is now selectable and actually requested, and the panel names it. Second, structure breaks were detected with a crossover against a moving reference, so a break could be reported simply because the reference jumped to a new pivot rather than because price moved; a break is now counted once per level and only if price was on the other side when that level was set. Third, the script used two different pressure estimates — one for the bar colours, another for the panel — which disagreed on the same bar; there is now one. "BUY Signal", "SELL Signal", "BUY ACTIVE", "SQUEEZE" and "DUMP" are gone, alerts were added for all four events, and the thresholds and colours are configurable.
v1.0
First release.
How to get it
Open source and free on TradingView. Add it to your chart from the link below — no account needed here.
Open on TradingView