S/R Lines and 4h Alert
Marks the most recent support and resistance levels from pivots, and alerts you when price reaches one.
What it computes
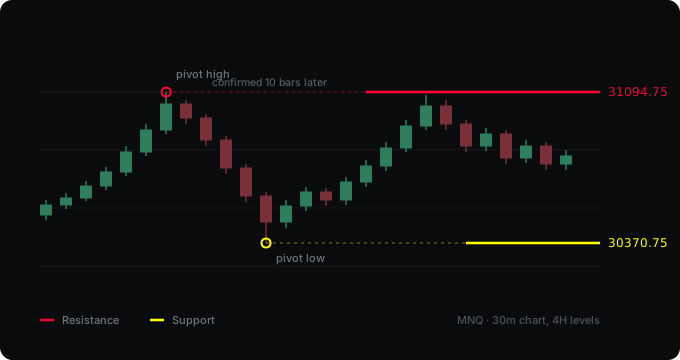
It looks for two things separately. A resistance is a candle whose high is above the highs of the N candles before and the M candles after it — a classic pivot high. A support is the same in reverse. By default it checks 10 candles on each side and uses 4-hour data, even when you are looking at a lower timeframe. Each level is drawn as a horizontal segment that runs from where it was confirmed until the next level replaces it, with the price written next to it.
What it assumes
That orders cluster around earlier local highs and lows: stops, limit orders and round-number levels sit there. When price returns to such a level, something is more likely to happen — a rejection, or a break on higher volume. What it does not claim: it cannot see who is on the other side, it does not read the order book, and it does not know whether an institutional order sits behind the level. It computes from public price data, nothing more.
Where it falls short
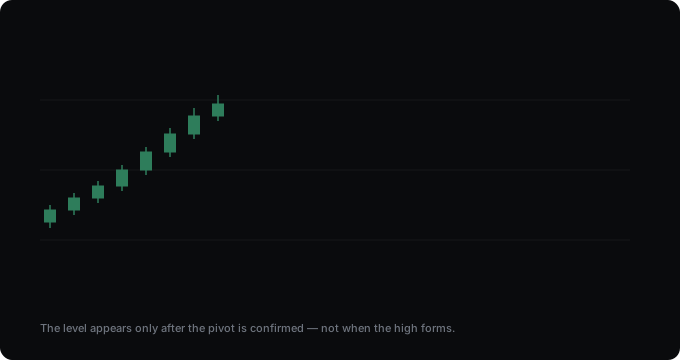
- It appears late. A level is only drawn once the set number of candles has passed after the high. On 4H with the default of 10, that is 40 hours. You do not see the level when it forms, but a day and a half later. That is not a flaw, it is the cost of the method: without it you could not know whether it really was a high.
- It is noisy in a range. When price moves in a narrow band, many pivots form in a row and the level keeps jumping. Raise the candle count in that case.
- It does not invalidate a broken level. If price breaks through a resistance, the segment simply ends when the next pivot forms. The judgement is yours: a broken resistance often becomes support, but the tool does not relabel it.
- On thinly traded instruments the local highs are closer to random noise than to real levels.
Backtest
There is none, and that is deliberate. This tool gives no entry signal, it only marks levels — there is nothing to measure. What can be measured is a specific entry rule built on these levels; that will be a separate tool, and the measurement will be published with it. If you see numbers next to a level-marking indicator, it is worth asking what exactly was measured.
Settings
| Setting | What it does |
|---|---|
| Left bars | How many candles must be lower before the high |
| Right bars | How many after. This is also the delay: a higher value means fewer but more reliable levels, drawn later |
| Use 4H levels | Shows 4H levels on a lower timeframe chart. On a 4H or higher chart it falls back to the chart's own levels and says so |
| Price label | Writes the exact price next to the line |
| Colours | Resistance and support colours are configurable |
| Alerts | Fires once per level, when price first reaches it. It does not repeat until a new level forms |
Changelog
v1.3
Historical display no longer uses future data. The earlier version requested 4H pivots with lookahead_on, which meant that on historical bars the script could use values that were not yet available at that point. Levels appeared earlier on the chart than they would have in live trading. With lookahead_off a level only appears once the pivot is confirmed, so the chart now shows what you would actually have seen. Also: alerts fire once per level instead of on every touching candle, prices follow the instrument's own tick size, on 4H or higher charts the script falls back to the chart's own levels, colours and line width are configurable, and the line limit was raised from 50 to 500.
v1.0
First release.
How to get it
Open source and free on TradingView. Add it to your chart from the link below — no account needed here.
Open on TradingView