Smart Volume Delta
Splits each bar's volume by where the close sits in the range, and marks the bars where that estimate disagrees with the candle itself.
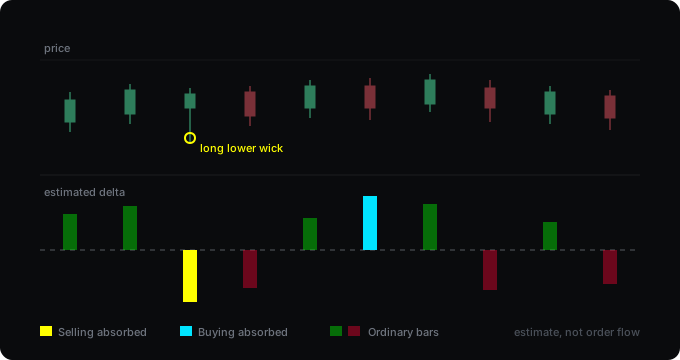
What it computes
For each bar it takes the total volume and divides it in proportion to where the close sits between the high and the low. A close near the high is counted as mostly buying, a close near the low as mostly selling, and the difference is plotted as a histogram. Two cases get their own colour: when the estimate points down but the bar closed up or left a long lower wick, and when it points up but the bar closed down or left a long upper wick.
What it assumes
That the shape of a bar carries information about who was pushing. A close pinned to the high after a wide range usually means buyers stayed in control; a long lower wick usually means selling was met. Where the estimate and the bar disagree, something interesting may have happened inside the bar. What it does not claim: this is not order flow. It cannot see the order book, it cannot see passive orders, and it has no idea whether a large resting order absorbed anything. It is arithmetic on one bar — a reason to look, not a conclusion.
Where it falls short
- The estimate is wrong whenever the shape of the bar does not reflect who was aggressive. A single large print at the close can pin the price to the high with almost no volume behind it, and the estimate will read that as heavy buying.
- Real delta needs tick data or at least a lower timeframe. TradingView has tools for that; this is not one of them. The advantage here is that it works on any instrument with volume, with no extra data feed.
- On instruments without real volume — most spot forex, for example — the whole thing is meaningless, because the volume being divided is itself a proxy.
- The marked bars are frequent. They are a filter for attention, not a signal: most of them lead nowhere, and the point is to make you look at the bar, not to act on it.
Backtest
There is none. The indicator gives no entry, stop or target — it colours bars. A rule built on it could be measured, and that would be a separate tool published with its results.

Settings
| Setting | What it does |
|---|---|
| Wick to body ratio | How much longer the wick has to be than the body to count as rejection. Raise it to mark fewer bars. |
| Bar width | The thickness of the histogram bars. |
| Fade on ordinary bars | Higher value pushes the unmarked bars further back, so the marked ones stand out. |
| Alerts | Both absorption cases. |
Changelog
v2.0
The wick detection never ran. It asked for the close to sit in the upper part of the bar while the same condition required a negative delta, which by definition means the close sits in the lower part — the two contradict each other, so half of the detection logic has never executed. The wick tests now measure the wick against the body, which is what they were meant to do, and the ratio is adjustable. Expect more marked bars than before. The indicator is also now named as what it is: an estimate from the bar's range and total volume, not order flow. Plus adjustable bar width and fade, alerts for both absorption cases, and configurable colours.
v1.0
First release.
How to get it
Open source and free on TradingView. Add it to your chart from the link below — no account needed here.
Open on TradingView